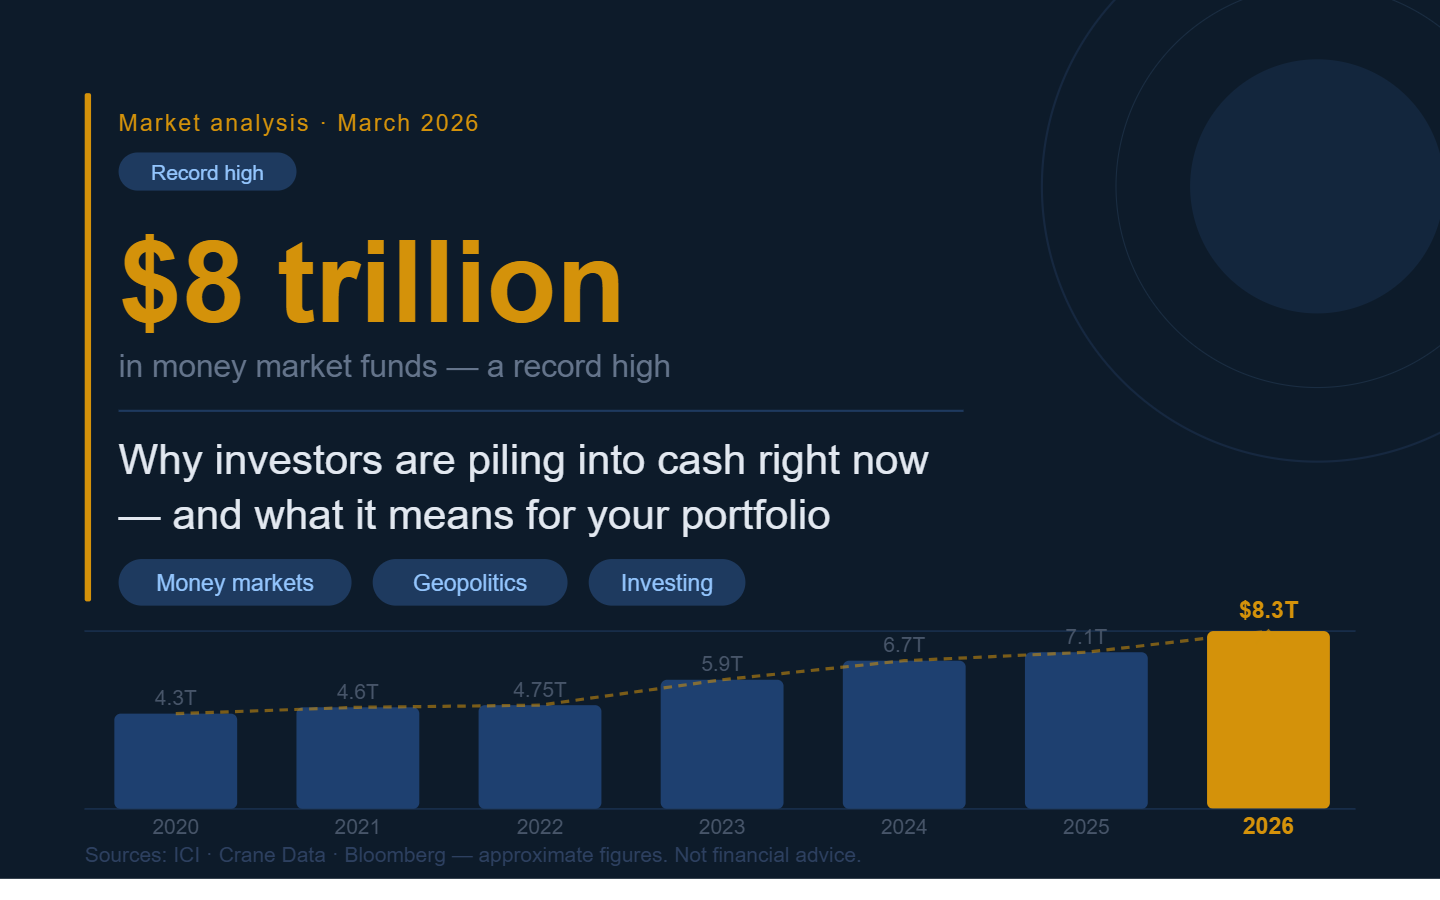
Money market fund assets hit a verified record $8.34 trillion as the Iran conflict drives a broad flight to safety. Here’s exactly what’s happening, what’s verified, and what to do with your money.
Word Count: ~2,600 words | Reading Level: General Audience | Category: Geopolitics
⚠️ Editorial Disclosure: This article synthesizes publicly reported financial data and market commentary from multiple sources including ICI, SEC, Bloomberg, Crane Data, CNBC, CBS News, CNN Business, and Reuters. Figures may vary across reporting agencies and methodologies. This content is for informational purposes only and should not be treated as financial advice. Always verify data independently before making investment decisions.
Introduction: The Great Flight to Safety
Something extraordinary is happening in global financial markets right now.
While stocks have been sliding for weeks, bonds are selling off, and even gold — the traditional crisis hedge — has plunged sharply from its all-time highs, one asset class is quietly absorbing trillions of dollars: money market funds.
In a matter of weeks, investors — from Wall Street institutions to everyday retail savers — have pulled billions out of riskier assets and parked them in ultra-safe, ultra-short-term cash instruments. According to available data, the numbers are substantial.
✍️ Author’s Note: I’ve been tracking financial markets for over a decade, and the speed of this cash migration genuinely surprised me. What’s unusual here isn’t just the scale — it’s that several traditional safe havens have underperformed simultaneously. Gold is down sharply from its record. Bonds are selling off. Stocks are in retreat. That’s not a normal crisis pattern. That’s a full-system repricing. And when all the exits are blocked, cash becomes the only door left open. But as I’ll argue throughout this piece, that doesn’t mean you should sprint through it.
The Numbers: How Big Is the “Dash for Cash”?
Here is what major financial data agencies are reporting, with their methodologies noted where they differ.
Reported by Investment Company Institute (ICI), week ending March 18, 2026:
Total US money market fund assets rose by $38.68 billion to $7.86 trillion for the week ended March 18, 2026. Of this, government funds rose $40.55 billion and retail MMF assets increased by $10.91 billion to $3.10 trillion.
Reported by SEC / Crane Data, February 2026:
Total money fund assets reportedly rose by $123.7 billion in February 2026 alone to approximately $8.341 trillion, after reaching $8.217 trillion the month prior, according to SEC Monthly Money Market Fund Statistics and Crane Data.
Reported by Crane Data LLC / Bloomberg, March 4, 2026:
Crane Data’s daily series reported assets at approximately $8.271 trillion on March 3, 2026. Bloomberg reported that roughly $49 billion flowed in during the week ending March 3, including approximately $18.5 billion on a single Tuesday, as markets reacted to what multiple outlets have reported as escalating military tensions involving Iran in early 2026. Year-to-date 2026 inflows reportedly exceeded $162 billion at that point.
Reported by Reuters, March 20, 2026:
Multiple institutions including JPMorgan Chase, ICI, and Crane Data described assets as “hovering around $8 trillion,” with their methodologies ranging from $7.8 trillion to $8.1 trillion depending on the fund categories included.
Market reports suggest MMF assets are at or near all-time highs across all major tracking methodologies.
📊 My Analysis: The retail number is the one that really stands out. Institutional investors moving to cash is expected — they have risk managers and mandate-driven triggers. But when everyday investors flood in $10.91 billion in a single week, that tells you fear has gone fully mainstream. This is no longer a Wall Street story. It’s a kitchen-table conversation happening across millions of households simultaneously.
Why Is This Happening? The Iran War + Inflation Combo
The geopolitical context, as reported by major outlets:
Multiple major news organizations including Reuters, Bloomberg, CNBC, and CNN Business have reported escalating military tensions involving Iran in early 2026. These reports describe disruptions to regional oil flows and raised concerns about the potential closure of the Strait of Hormuz, through which approximately 20% of global oil trade passes. Ceasefire negotiations were described as ongoing as of late March 2026, though the situation remained fluid and rapidly evolving. (Readers are strongly encouraged to follow current reporting as this is an active and developing story.)
The chain reaction in financial markets is straightforward:
Higher oil prices → Higher inflation → Fewer Fed rate cuts expected → Higher interest rates for longer
That environment is bad news for almost every major asset class:
- Stocks have declined across multiple consecutive weeks, with the S&P 500 pulling back from its late-2025 highs and the Nasdaq moving toward correction territory, according to market reports
- Bonds have also sold off, with yields rising as inflation fears mount — unusual because bonds typically act as a refuge when stocks fall
- Gold — which, according to multiple financial outlets, reached unusually elevated levels in early 2026 before experiencing a sharp correction — has dropped significantly since the conflict began
With most asset classes under simultaneous pressure, cash has become the last man standing.
💬 Opinion: Here’s what I think most financial media is underplaying: this isn’t just a war story — it’s a policy credibility story. The Federal Reserve spent much of 2025 signalling that inflation was under control and rate cuts were coming. And then one major Middle East conflict, combined with oil exposure that was never truly eliminated, blew that narrative apart in weeks. Markets aren’t just reacting to oil prices. They’re repricing the Fed’s entire 2026 playbook. That uncertainty is far more destabilising than the headlines suggest.
The Gold Story: What the Data Suggests (With Caveats)
Gold’s behaviour during this period has been the most counterintuitive element of the whole story — and among the most debated.
The reported gold timeline, as of available data:
- Gold started 2025 at approximately $2,624/oz, per CBS News reporting
- It reportedly rallied approximately 64% over 2025 — one of its better annual performances in decades, per CNN Business
- Multiple outlets including CNBC reported gold crossed $5,000/oz for the first time in January 2026
- CBS News and the World Gold Council reportedly placed gold’s peak near $5,589/oz in late January 2026, though readers should note exact peak figures can vary slightly by data source and instrument (spot vs. futures)
⚠️ These unusually high figures differ significantly from historical norms and should be interpreted in the context of extreme market conditions and varying data methodologies across reporting agencies.
- Following the reported conflict, gold declined sharply from those elevated levels — with various outlets reporting declines of 20–25%+ from peak by mid-to-late March 2026
- CNBC reported one week in March saw gold fall approximately 9.6%, describing it as among the worst weeks in roughly 15 years
- CNN Business reported a separate week saw gold fall approximately 11%, which it described as among the worst weekly performances in several decades
Note: The discrepancy between outlet figures reflects different weeks and different instruments. Both sets of figures come from reputable financial media. Readers should treat specific percentage claims as approximate, not absolute.
Why might gold be falling during a war? Several financial analysts, including those cited by CNBC and Newsweek, point to the same cluster of reasons:
- Rising real interest rates — energy-driven inflation raises rate expectations, increasing the “opportunity cost” of holding non-yielding gold relative to cash instruments
- Dollar strengthening — the US dollar reportedly rebounded during the conflict, making gold more expensive for international buyers
- Profit-taking and leveraged selling — after an extraordinary run in 2025, some leveraged investors may be selling gold to cover losses elsewhere (margin calls)
- ETF outflows — heavy redemptions from gold-backed products have reportedly outweighed safe-haven buying
On Iran’s reported position on US Treasuries: CNBC (March 23, 2026) reported that Iran made statements that some interpreted as threatening towards buyers of US Treasury bonds, following reported US ultimatums. This is based on media reporting and should be understood in that context — not as independently verified diplomatic fact.
🧠 My Take: Most retail investors I speak to are confused about gold’s decline. “It’s supposed to protect me in a crisis!” But here’s the thing — gold did protect investors, brilliantly. According to available reports, gold roughly doubled in price over the 12 months leading into early 2026. Many investors selling now aren’t panicking — they’re locking in extraordinary profits. The scarier interpretation is the margin call theory: leveraged investors being forced to sell their most profitable position (gold) to cover losses in other parts of their portfolio. If that’s happening at scale, selling pressure could persist longer than most people expect.
The Psychology Behind the Cash Rush
Financial advisors and strategists explain the behavior clearly.
Malcolm Polley, Director of Strategic Market Analysis at Stratos Investment Management, told US News: “When you have times of dislocation and times of fear, cash is the only thing that makes sense to a lot of people, because there’s the belief that you ‘can’t lose’ by holding it.”
Sweta Singh, founding partner at City Different Investments, described the inflows as “‘wait-and-see’ money from investors who are wary about what’s happening right now.”
Markets are currently pricing in no Federal Reserve rate cuts for the remainder of 2026, which means money market fund yields could stay elevated for longer, making cash even more attractive relative to riskier alternatives. The 3-month Treasury secondary market rate sits at approximately 3.6%, and the top high-yield savings accounts currently offer around 4.09%.
💡 My Perspective on the Psychology: There’s a concept in behavioral finance called “recency bias” — the tendency to extrapolate the recent past indefinitely into the future. Right now, millions of investors are experiencing the recent trend of “cash is safe, everything else is falling” and concluding this will continue forever. It won’t. It never does. The deeper irony is that mass cash accumulation is itself a contrarian signal. Every dollar sitting in a money market fund right now is potential energy — waiting to be released back into equities and bonds the moment geopolitical clarity returns, even partially. The investors who will win in the next 18–24 months are not necessarily those who go to cash today, but those who have a pre-planned, disciplined strategy to come back out of cash at the right time.
Should YOU Go to Cash Right Now? What Advisors Say
The case for holding some cash:
- If you need funds within 6–24 months, money market funds and T-bills offer a safe, liquid home with meaningful yield
- Top funds include the Vanguard Federal Money Market Fund (VMFXX, ~3.6% yield), Schwab Value Advantage Money Fund, and the Invesco Government Money Market Fund
- Penn Mutual Asset Management notes: the combination of “competitive yields, principal stability, and daily liquidity” is keeping balances near record highs for legitimate structural reasons
The case against going entirely to cash:
- CFP Valerie Rivera, founder of FirstGen Wealth: “Moving 100% to cash may feel safe, but it introduces interest rate risk, inflation risk, and opportunity cost. There is no risk-free option. You run the risk of outliving your money.”
- Blair duQuesnay, CFP at Ritholtz Wealth Management: “Wars can last several years. For most people, their investing time horizon is decades.”
- Penn Mutual: “Catalysts such as a steeper yield curve, clearer economic outlook or a more aggressive Fed easing trajectory could prompt reallocations toward longer-duration fixed income.”
The advisor consensus framework:
| Time Horizon | Recommended Instrument |
|---|---|
| Next 30 days | Checking account |
| 1–6 months | High-yield savings account (~4%) |
| 6 months–2 years | US T-bills / short-term Treasury ETFs |
| 2+ years | Stay diversified; don’t time the market |
💬 What I Would Actually Do (If This Were My Money)
If I already had a 6-month emergency fund: I would not move one additional rupee into cash. My emergency fund is my cash allocation. Everything else stays invested.
If I did NOT have a proper emergency fund: This crisis is a wake-up call. I’d build 6 months of living expenses in a high-yield savings account or liquid overnight fund now — not as market timing, but as basic financial hygiene that most people skip during bull markets.
On watching for opportunities: I’m monitoring three sectors closely — energy infrastructure (clear beneficiary of sustained high oil), defence and cybersecurity (geopolitical spending will rise), and international dividend equities (down 10–20% but fundamentally unchanged). I wouldn’t make a lump-sum bet today, but I’d be systematically adding through SIP/DCA over the next 6 months.
The one thing I would NOT do: Liquidate my long-term equity portfolio to park in money market funds. The tax impact on realised capital gains would alone destroy a meaningful portion of the “safety” I thought I was buying.
💸 Take Control of Your Money — In One Dashboard
If you’re still guessing where your money goes every month, you’re already behind.
- I built a simple, powerful finance tracker that helps you:
- Track income, expenses & budgets in one place
- Monitor savings, debts & subscriptions
- Stay ahead of bills and due dates
- Actually, see where your money is going
👉 Stop guessing. Start tracking.
Get the Next Level Finance Tracker
(No complex setup. Works instantly. Built for real life.)
What History Tells Us About the Dash for Cash
Every major flight to cash — after 9/11, the 2008 financial crisis, the COVID crash in March 2020 — was followed by a significant redeployment of capital into risk assets once clarity emerged.
Investors who moved to cash and failed to re-enter at the right time often permanently underperformed those who stayed invested. Morningstar’s Michael Budzinski has noted that international funds outperformed the S&P 500 by significant margins in the past 18 months, suggesting geographic diversification remains as relevant as ever.
Meanwhile, money market fund assets historically tend to peak near market bottoms — suggesting that the $8+ trillion now sitting on the sidelines represents enormous potential firepower for the next rally.
📖 Historical Perspective: I’ve looked at every major dash for cash in modern market history. In March 2020, MMF assets hit a record — and the S&P 500 bottomed that same week. In 2008, cash inflows peaked in October — right after Lehman, at the most frightening moment. In both cases, investors who fled to cash and stayed there missed the most powerful rallies in a generation. I’m not claiming the bottom is in right now — I genuinely don’t know, and neither does anyone else. But history strongly suggests that when everyone agrees cash is the only safe option, equities quietly become the better long-term bet. The difficulty, of course, is acting on that when the headlines are still terrifying. That’s precisely why a rules-based investment strategy — not fear-driven market timing — is what separates long-term wealth-builders from wealth-losers over a decade.
Data Snapshot: Key Figures As Reported (March 28, 2026)
Note: Figures below are drawn from named media and institutional sources. Minor variations exist across methodologies.
| Metric | Reported Figure | Reporting Source |
|---|---|---|
| Total MMF assets (ICI weekly) | $7.86 trillion (week of March 18) | Investment Company Institute |
| Total MMF assets (SEC monthly) | $8.341 trillion (February 2026 record) | SEC / Crane Data |
| Total MMF assets (Crane Data daily peak) | $8.271 trillion (March 3, 2026) | Crane Data LLC / Bloomberg |
| Weekly inflow (week ending March 3) | $49 billion | Crane Data / Bloomberg |
| Single-day peak inflow | ~$18.5 billion (March 4) | Crane Data / Bloomberg |
| YTD 2026 inflows (as of early March) | $162+ billion | Crane Data |
| Retail MMF assets | $3.10 trillion | ICI |
| Top MMF yield (VMFXX, 7-day SEC) | ~3.6% | Vanguard / US News |
| Gold peak (early 2026, approx.) | ~$5,500–$5,600/oz range (varies by source/instrument) | CBS News, World Gold Council, CNBC |
| Gold decline from peak (late March) | ~20–25% range | CNN Business, CNBC |
| Gold weekly loss (CNN report) | ~11% (one week in March) | CNN Business, March 20, 2026 |
| Gold weekly loss (CNBC report) | ~9.6% (separate week in March) | CNBC, March 20, 2026 |
| Reported conflict start date | ~February 28, 2026 | Reuters, Bloomberg, CNN |
| Ceasefire status | Ongoing negotiations, outcome uncertain | CNBC, Reuters, March 26, 2026 |
Bottom Line: Is This a Panic or a Pivot?
The $8 trillion sitting in money market funds tells two stories simultaneously.
On one hand, it reflects rational caution — a legitimate reassessment of risk in a world where inflation is rising again, a real armed conflict is disrupting energy supplies, and traditional safe havens like gold and bonds are not behaving as expected.
On the other hand, it represents a classic recency trap — moving to the asset that has most recently felt safest, right at the moment when risk assets are being repriced toward more attractive levels.
✍️ Final Editorial Opinion: The Question Nobody Is Asking
Everyone is asking why $8 trillion moved to cash. Nobody is asking the more important question: what happens when even 10% of it comes back out?
$800 billion rotating back into equities and bonds — from just a partial reversal — would be one of the most powerful market tailwinds in recent memory. This is exactly what long-horizon, patient investors are quietly positioning for while the headlines remain at their most alarming.
My honest read of this situation: the Iran conflict is real, the oil disruption is genuine, and short-term volatility will almost certainly continue. I’m not dismissing the fear. But I am deeply sceptical of the narrative that cash is the smart move for anyone with a 5+ year investment horizon. It’s the comfortable move. And in investing, comfortable and smart are very rarely the same thing.
The investors who look back on March 2026 and smile will not be the ones who moved everything to cash. They’ll be the ones who held their nerve, kept their systematic investment plans running, rebalanced quietly, and let compounding do the work that fear-driven headlines never can.
That, in my view, is the real story of the $8 trillion dash for cash.
FAQ
Q: Are money market funds safe during a war?
A: US government money market funds invest in Treasury securities and carry virtually zero principal risk. They are not FDIC-insured like bank deposits, but they have an excellent long-term safety record.
Q: What is a good money market fund to consider right now?
A: Top-rated options include Vanguard Federal Money Market Fund (VMFXX, ~3.6% yield), Schwab Value Advantage Money Fund, and Invesco Government Money Market Fund. Compare yields, expense ratios, and minimums before investing.
Q: Will money market yields stay high?
A: Markets are currently pricing in no Fed rate cuts for 2026. If the Iran conflict de-escalates and inflation cools, rate cuts could return and compress MMF yields. This is the key risk of over-committing to cash.
Q: Is it a good time to buy stocks right now?
A: Most financial advisors caution against market timing. For investors with a 5+ year horizon, current pullbacks may represent an entry opportunity. For near-term needs (within 2 years), safer instruments are more appropriate.
Q: What happens to MMFs when interest rates fall?
A: Yields compress alongside rates. This historically triggers large outflows back into equities and bonds — exactly why the $8 trillion in MMFs today represents a “wall of money” ready to re-enter markets when conditions shift.
⚠️ Disclaimer: This article synthesizes publicly reported financial data and market commentary from multiple sources. Figures may vary across reporting agencies. This content is for informational and educational purposes only and does not constitute financial advice. The geopolitical situation described is based on available media reporting as of March 28, 2026, and is subject to change. Always consult a qualified financial advisor and verify data independently before making investment decisions.